VISION TEST
NEAR VISION CHART (N CHART)
Synonym
Near vision acuity, visual acuity test, Jaeger eye chart
In 1854, Eduard Jaeger, an Austrian ophthalmologist developed a new chart designed to test acuity after cataract surgery. This chart was then used to diagnose refractive errors such as myopia (nearsightedness) or hyperopia (farsightedness).
Indications
To measure near vision acuity (myopia-nearsightedness) without wearing glasses or contact lenses.
How to use
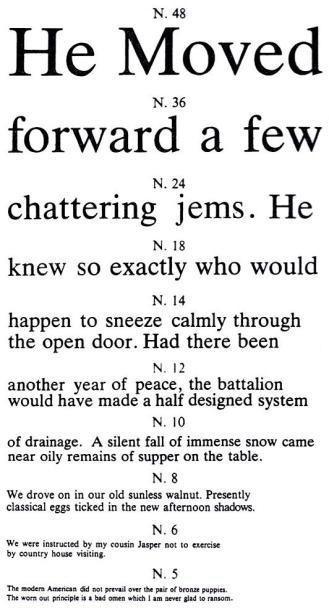
- The N or near vision chart is used for the measurement of visual acuity at a distance of 30 cm or 1 foot from the chart in good lighting.
- This chart uses the Times New Roman font with different font sizes ranging from 48 to 5. A Normal eye should be able to read clearly the letter with font size 6.
- Close the left eye and read the chart from top downwards with the right eye.
- Near vision of the tested eye (i.e. left eye) is recorded as the smallest font size that can be read comfortably. For example, N8 for the right eye.
- Repeat the same steps to test near vision of the left eye.
Reference
Keeney AH, Duerson HL (1958) Collated Near-Vision Test Card*. American Journal of
Ophthalmology. 46(4):592-594. doi:10.1016/0002-9394(58)91140-1
SNELLEN CHART
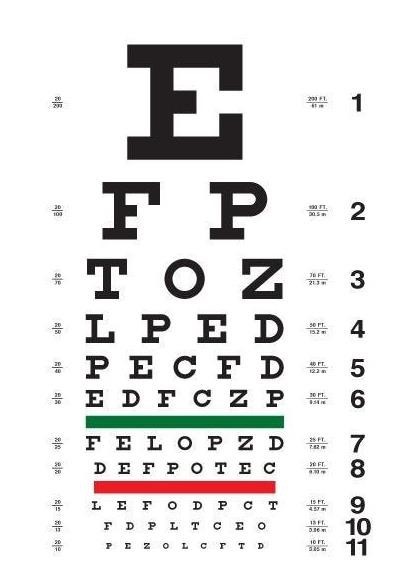
A classic example of an eye test is the Snellen eye chart, developed by Dutch eye doctor
Hermann Snellen in the 1860s. There are many variations of the Snellen test, including:
- 11 rows of capital letters
- A top row with only one letter, often a big “E.” Other letters can also be used
- Lower rows that also contain letters, but get progressively smaller
A. Snellen Chart is used for Visual Acuity
Distance vision; during an eye exam, your eye doctor will ask you to find the smallest line of
letters you can read, and then ask you to read it. If you can read the bottom row of letters,
your visual acuity (sharpness) is very good.
- The Snellen chart is used for the measurement of visual acuity at a distance of 6 meters (m) in good lighting.
- The chart has different letter sizes to be read by each eye separately. A subject with normal vision should be able to see clearly the first line at a distance of 60 m, the second line at 36 m and the following lines at 24, 18, 12, 9, 6 and 5 m.
Directions For Use
For the best accuracy (and to prevent memorization), have assistance when testing your vision. Place the chart on a wall or easel 6 metres away (The display chart is in a pocket size, place the card 6 feet from the eyes).
- Cover one eye with your hand, which completely blocks the vision of the covered eye (Do not apply pressure to the covered eye, as it might affect that eye’s vision when you test it).
- Identify a line on the chart you can comfortably read. Read the letters on that line aloud. Have your assistant stand near the chart and record your accuracy.
- Continue trying to read the letters on each successively smaller line. Do not squint.
- Have your assistant stop you when you fail to correctly identify at least 50 per cent of the letters on a line.
- Switch to the other eye and repeat.
- Record your visual acuity for each eye by noting the line for which you correctly identified
- Visual acuity (V) is expressed as V = d/D
d = distance in meter between the chart and the subject’s eye (6m)
D= corresponding distance in meters of the smallest line of letters that can be read clearly by the tested eye.
- For example, if line 5 is the smallest line of letters that can be read by the tested eye at a
distance of 6 meters from the chart, the result is V= 6/12.
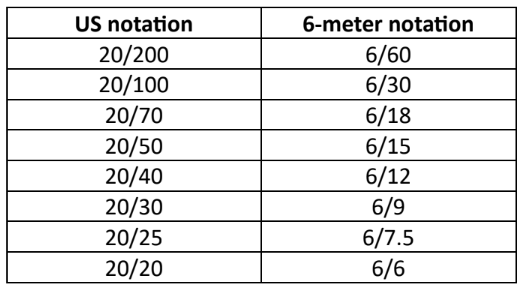
The following table compares different visual acuity notations
GREEN CHART
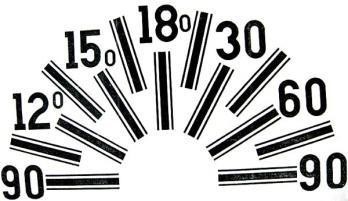
B. Green Chart is used to check for Astigmatism
Green or Astigmatism chart has parallel lines representing different meridians of the eyeball.
All parallel lines should be seen clearly with equal contrast by a normal eye in good lighting.
Directions For Use
AT NEAR POINT
- Cover your left eye with your cupped left palm or an eye patch. Keep the covered eye open.
- Hold the Astigmatism Self-Test Chart 12 to 16 inches away from you with the centre dot at eye level, directly in line with your left eye.
- Look at the centre white circle and become aware of the lines radiating out from the centre.
- Note which lines appear blacker, which appear greyer or less distinct, and which appear wavy or less clear.
- Repeat steps 1 to 4, with your right eye covered and the chart in line with your left eye.
AT FAR POINT
- Attach the Astigmatism Self-Test Chart to the wall so the centre white circle is about eye level, and then stand 3 to 4 feet away.
- Cover your left eye with your cupped left palm or an eye patch (keeping the covered eye open); making sure that the centre dot is directly in line with your uncovered eye.
- Look at the centre white circle and become aware of the lines radiating out from the centre.
- Note which lines appear blacker, which appear greyer or less distinct, and which appear wavy or less clear.
- The lines that go in the direction of the least clarity – distorted, blurry or grey - reflect your Angle of Astigmatism, at least for now.
- Repeat steps 2 to 4, for your other eye.
What To Watch For In Both Tests:
Notice the difference between the lines with the least clarity and those with the most blackness. You may see a range of lines that are blacker and a range of lines that are greyer, or least distinct, blurry or wavy. Or there may be a smooth gradation from the blackest to the greyest.
ISHIHARA PLATES
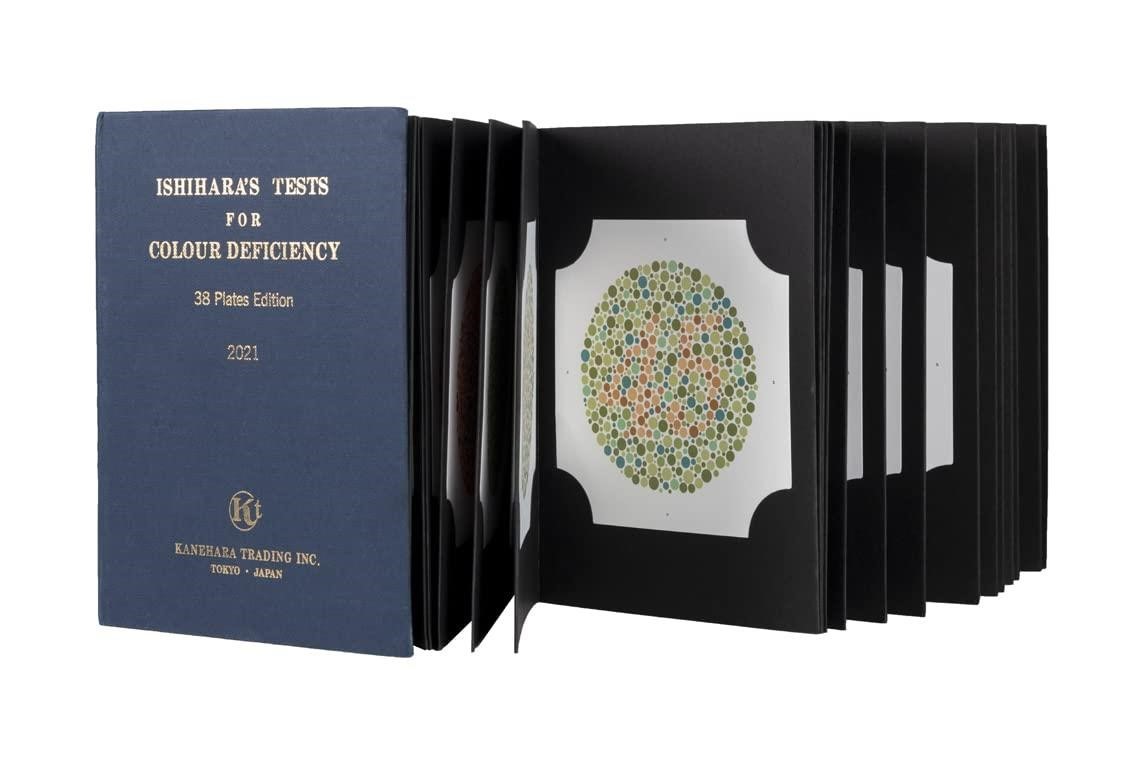
Indication
To assess colour vision deficiency of congenital origin, the most common form of colour disturbance
How to use
- The plates are held 75 cm from the subject in good lighting and tilted so that the plane of the paper is at right angles to the line of vision.
- Ask the subject to read the numerals that are seen on plates 1-17 and each answer should be given within 3 seconds.
- The Ishihara test booklets can be referred to for diagnosis.